Infographic is a form of multimedia that uses multimedia techniques to improve learning. In Blog 3: Multimedia Learning Objects and Artifacts, I designed an infographic about digital learning. The blog included a few details, augmented with a few images. In assignment three blog, I improved the infographic on digital learning by incorporating more details. I combined images, charts, and written content to reflect the core multimedia skills. I made the changes to incorporate the SAMR Model, SECTION Model, and the TPACK Model
The theories of the SAMR model are evident when the two blogs are compared. At the start of the course, we were introduced to the substitution and augmentation of learning materials. This infographic is more of modelling and redefinition of learning. The multimedia learning skills are presented in a blog creatively to generate content that can be easily understood by other students (Bates, 2019). In this way, technology is used to model and redefine learning.
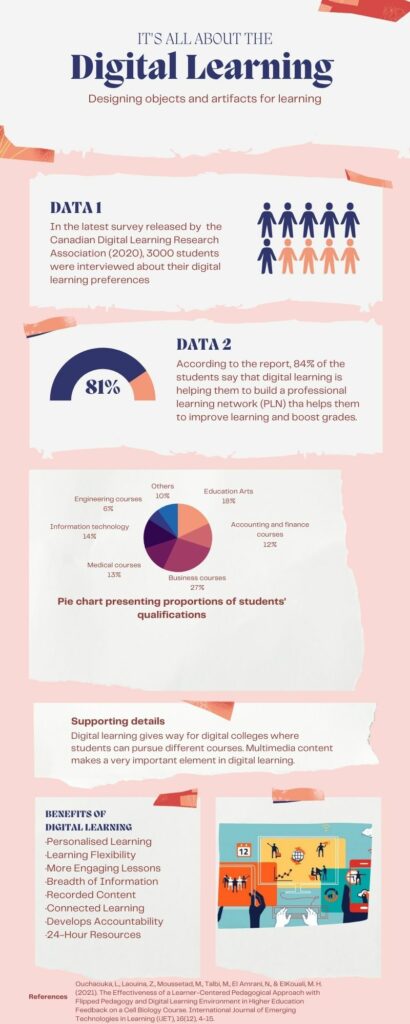
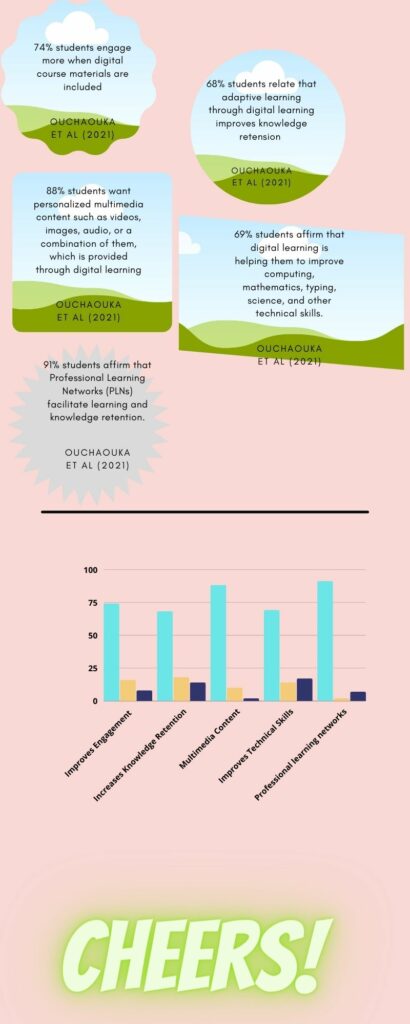
I used the SECTION model to determine the learning outcomes (What is the Purpose of School, 2020). The infographic is a creative way of presenting analytical skills. For example, the infographic summarizes different studies on why students prefer digital learning. I introduced data and supporting details from studies on the first page, and in the second, I used charts to present the data. Infographics help students input data and derive charts, histograms, and other visual analytical tools that help learners to visualize situations.
For someone who would want to view a summary of different studies, information delivered through infographics is easier to read, understand, comprehend, and remember. Dual coded information is essential in learning as it improves knowledge retention. An infographic minimizes extraneous processing through signalling, temporal contiguity, redundancy, and spatial contiguity (Cognitive Theory of Multimedia Learning, 2011).
Overall, the design helped me to create advanced content that integrates data analysis into learning. It is much easier to share knowledge with a large audience using an infographic than sharing books and articles about all the sources used in research. If someone conducts a study that results in huge documentation, it could be easier to share the findings using a short, detailed infographic, thereby facilitating knowledge transfer.
References
Bates, T. (2019). Teaching in a Digital Age – Models for media selection. https://pressbooks.bccampus.ca/teachinginadigitalagev2/chapter/9-1-models-formedia-selection/.
Cognitive Theory of Multimedia Learning. (2011). In ETEC510: Design Wiki.
http://etec.ctlt.ubc.ca/510wiki/Cognitive_Theory_of_Multimedia_Learning
What is the Purpose of School? (2020) Demystifying SAMR with Dr. Ruben Puentedura. https://www.youtube.com/watch?v=L9h9ePoXqS8
Leave a Reply